pip install pycsodataTutorial
This tutorial provides a short overview of the functionalities of the pycsodata package, using the dataset NDQ05 as an example.
Installing the package
Installation is via pip:
Finding datasets in the catalogue
We can get a dataframe containing all CSO datasets, sorted by date updated, as follows:
from pycsodata import CSOCatalogue

cat = CSOCatalogue()

# Load catalogue's entire table of contents
toc = cat.toc()
toc.head()| Code | Title | Variables | Time Variable | Date Range | Updated | Organisation | Exceptional | |
|---|---|---|---|---|---|---|---|---|
| 0 | PCA18 | Prodcom Sales 2019 | [Year, Product] | Year | 2019 | 2026-04-08 | Central Statistics Office, Ireland | False |
| 1 | ROA32 | Driving Test Applications | [Month, Driving Test Categories, Driving Test ... | Month | 2021 January - 2026 March | 2026-04-08 | Road Safety Authority (RSA) | False |
| 2 | AKM01 | Intake of Cows Milk by Milk Processors and Co-Ops | [Month, Domestic or Import Source] | Month | 1975 January - 2026 February | 2026-04-08 | Central Statistics Office, Ireland | False |
| 3 | AKM02 | Milk Sales (Dairy) for Human Consumption | [Month, Type of Milk] | Month | 1980 January - 2026 February | 2026-04-08 | Central Statistics Office, Ireland | False |
| 4 | AKM03 | Production of Dairy Products | [Month, Product] | Month | 1980 January - 2026 February | 2026-04-08 | Central Statistics Office, Ireland | False |
Now, suppose that we are interested in finding datasets on new dwelling completions at county level. We can search for these in the catalogue as follows:
# Search the catalogue by its various fields
results = cat.search(
    title="new dwelling",
    variables="county OR counties OR 'local authority'")
results.head()| Code | Title | Variables | Time Variable | Date Range | Updated | Organisation | Exceptional | |
|---|---|---|---|---|---|---|---|---|
| 0 | NDQ06 | New Dwelling Completion | [Quarter, Type of House, Local Authority] | Quarter | 2011Q1 - 2025Q4 | 2026-01-29 | Central Statistics Office, Ireland | False |
| 1 | NDQ05 | New Dwelling Completion | [Quarter, Local Authority] | Quarter | 2011Q1 - 2025Q4 | 2026-01-29 | Central Statistics Office, Ireland | False |
| 2 | BHQ17 | Planning Permissions Granted for New Houses an... | [Quarter, County, Type of Dwelling] | Quarter | 1975Q1 - 2025Q4 | 2026-03-12 | Central Statistics Office, Ireland | False |
| 3 | BHA14 | Planning Permissions Granted for New Houses an... | [Year, County, Type of Dwelling] | Year | 1975 - 2025 | 2026-03-12 | Central Statistics Office, Ireland | False |
| 4 | SAP2022T6T10CTY | Households with Renewable Energy Source | [Census Year, Administrative Counties, Renewab... | Census Year | 2022 | 2023-09-15 | Central Statistics Office, Ireland | False |
Loading datasets
We can load the dataset with table code NDQ05 and print its metadata as follows:
from pycsodata import CSODataset

# Load the CSO dataset with code "NDQ05"
ds = CSODataset("NDQ05")

# Print its metadata
ds.describe()
Code: NDQ05
Title: New Dwelling Completion
Variables: [1] Statistic
(1) New Dwelling Completion
Unit: Number
[2] Quarter
[3] Local Authority
Tags: Official Statistics, Geographic Data
Time Variable: Quarter
Geographic Variable: Local Authority
Last Updated: 2026-01-29
Reason for Release: Planned Routine Revision
Notes: * Classification into local authorities has taken into account
boundary changes between Cork City and Cork County which came
into effect in May 2019. All data within this table for all
quarters is now based on these new boundaries.
* For more information, please go to the statistical release page
(https://www.cso.ie/en/statistics/construction/newdwellingcompletions/)
on our website.
Contact Name: Steven Conroy
Contact Email: housing@cso.ie
Contact Phone: (+353) 1 498 4311
Copyright: Central Statistics Office, Ireland (https://www.cso.ie/)
We can then load this dataset into a pandas DataFrame:
df = ds.df()
df.head()| Statistic | Quarter | Local Authority | value | |
|---|---|---|---|---|
| 0 | New Dwelling Completion | 2011Q1 | Ireland | 1875.0 |
| 1 | New Dwelling Completion | 2011Q1 | Cork City Council | 39.0 |
| 2 | New Dwelling Completion | 2011Q1 | Clare County Council | 52.0 |
| 3 | New Dwelling Completion | 2011Q1 | Cavan County Council | 61.0 |
| 4 | New Dwelling Completion | 2011Q1 | Cork County Council | 168.0 |
Pivoting
There are three available pivot_format options for the resulting DataFrame. The default is "long", where both the Statistic and Time Variable (typically Year, Quarter, or similar) columns are stacked.
Alternatively, pivot_format="wide" can be used to give each Time Variable its own column:
from pycsodata import CSODataset

# Load the CSO dataset with code "NDQ05"
ds = CSODataset("NDQ05")

df = ds.df("wide")
df.head()| Statistic | Local Authority | 2011Q1 | 2011Q2 | 2011Q3 | 2011Q4 | 2012Q1 | 2012Q2 | 2012Q3 | 2012Q4 | ... | 2023Q3 | 2023Q4 | 2024Q1 | 2024Q2 | 2024Q3 | 2024Q4 | 2025Q1 | 2025Q2 | 2025Q3 | 2025Q4 | |
|---|---|---|---|---|---|---|---|---|---|---|---|---|---|---|---|---|---|---|---|---|---|
| 0 | New Dwelling Completion | Ireland | 1875.0 | 1791.0 | 1687.0 | 1641.0 | 1131.0 | 1117.0 | 1205.0 | 1458.0 | ... | 8393.0 | 10207.0 | 5797.0 | 6813.0 | 8878.0 | 8659.0 | 5914.0 | 9163.0 | 9213.0 | 11994.0 |
| 1 | New Dwelling Completion | Cork City Council | 39.0 | 36.0 | 51.0 | 25.0 | 20.0 | 27.0 | 26.0 | 22.0 | ... | 156.0 | 319.0 | 237.0 | 301.0 | 306.0 | 376.0 | 278.0 | 327.0 | 495.0 | 399.0 |
| 2 | New Dwelling Completion | Clare County Council | 52.0 | 49.0 | 47.0 | 57.0 | 44.0 | 38.0 | 39.0 | 39.0 | ... | 95.0 | 123.0 | 127.0 | 102.0 | 159.0 | 146.0 | 129.0 | 187.0 | 145.0 | 164.0 |
| 3 | New Dwelling Completion | Cavan County Council | 61.0 | 28.0 | 45.0 | 37.0 | 20.0 | 23.0 | 23.0 | 33.0 | ... | 92.0 | 70.0 | 50.0 | 69.0 | 60.0 | 65.0 | 57.0 | 80.0 | 115.0 | 98.0 |
| 4 | New Dwelling Completion | Cork County Council | 168.0 | 200.0 | 164.0 | 194.0 | 122.0 | 115.0 | 129.0 | 148.0 | ... | 539.0 | 522.0 | 458.0 | 532.0 | 678.0 | 647.0 | 442.0 | 512.0 | 544.0 | 730.0 |
5 rows × 62 columns
Or pivot_format="tidy" can be used to give each Statitistic its own column:
df = ds.df("tidy")
df.head()| Quarter | Local Authority | New Dwelling Completion | |
|---|---|---|---|
| 0 | 2011Q1 | Ireland | 1875.0 |
| 1 | 2011Q1 | Cork City Council | 39.0 |
| 2 | 2011Q1 | Clare County Council | 52.0 |
| 3 | 2011Q1 | Cavan County Council | 61.0 |
| 4 | 2011Q1 | Cork County Council | 168.0 |
Including ID codes
The include_ids argument can be used to choose for which dimensions of the dataset an additional ID codes column should be included. The options are "none" (default), "all", "spatial_only" (which only applies to datasets including spatial data), or a list of columns for which IDs should be included. For example:
from pycsodata import CSODataset

# Include all ID code columns
ds = CSODataset("NDQ05", include_ids="all")

df = ds.df()
df.head()| Statistic | Statistic ID | Quarter | Quarter ID | Local Authority | Local Authority ID | value | |
|---|---|---|---|---|---|---|---|
| 0 | New Dwelling Completion | NDQ05 | 2011Q1 | 20111 | Ireland | - | 1875.0 |
| 1 | New Dwelling Completion | NDQ05 | 2011Q1 | 20111 | Cork City Council | 2ae19629-1434-13a3-e055-000000000001 | 39.0 |
| 2 | New Dwelling Completion | NDQ05 | 2011Q1 | 20111 | Clare County Council | 2ae19629-14a2-13a3-e055-000000000001 | 52.0 |
| 3 | New Dwelling Completion | NDQ05 | 2011Q1 | 20111 | Cavan County Council | 2ae19629-149d-13a3-e055-000000000001 | 61.0 |
| 4 | New Dwelling Completion | NDQ05 | 2011Q1 | 20111 | Cork County Council | 2ae19629-14a3-13a3-e055-000000000001 | 168.0 |
Dropping national aggregates
The drop_national_data argument can be used to attempt to drop national aggregate rows (note that this may not always work, but in this case rows with Local Authority ‘Ireland’ are successfully dropped):
from pycsodata import CSODataset

# Drop rows corresponding to national data
ds = CSODataset("NDQ05", drop_national_data=True)

df = ds.df()
df.head()| Statistic | Quarter | Local Authority | value | |
|---|---|---|---|---|
| 0 | New Dwelling Completion | 2011Q1 | Cork City Council | 39.0 |
| 1 | New Dwelling Completion | 2011Q1 | Clare County Council | 52.0 |
| 2 | New Dwelling Completion | 2011Q1 | Cavan County Council | 61.0 |
| 3 | New Dwelling Completion | 2011Q1 | Cork County Council | 168.0 |
| 4 | New Dwelling Completion | 2011Q1 | Carlow County Council | 17.0 |
Applying filters
The data can be conveniently filtered on any of its dimensions by passing filters, a dictionary mapping each dimension to a list containing a subset of values:
from pycsodata import CSODataset

# Filter the data
ds = CSODataset("NDQ05", filters={
        "Quarter":["2025Q1", "2025Q2", "2025Q3", "2025Q4"],
        "Local Authority":["Wicklow County Council"]})
df = ds.df()
df.head()| Statistic | Quarter | Local Authority | value | |
|---|---|---|---|---|
| 0 | New Dwelling Completion | 2025Q1 | Wicklow County Council | 305.0 |
| 1 | New Dwelling Completion | 2025Q2 | Wicklow County Council | 273.0 |
| 2 | New Dwelling Completion | 2025Q3 | Wicklow County Council | 336.0 |
| 3 | New Dwelling Completion | 2025Q4 | Wicklow County Council | 466.0 |
The drop_filtered_cols argument can be used to drop the filtered columns when they no longer provide useful information:
# Filter the data and drop filtered columns
ds = CSODataset("NDQ05", filters={
        "Local Authority":["Wicklow County Council"]
        }, drop_filtered_cols=True)
df = ds.df()
df.head()| Statistic | Quarter | value | |
|---|---|---|---|
| 0 | New Dwelling Completion | 2011Q1 | 74.0 |
| 1 | New Dwelling Completion | 2011Q2 | 37.0 |
| 2 | New Dwelling Completion | 2011Q3 | 60.0 |
| 3 | New Dwelling Completion | 2011Q4 | 47.0 |
| 4 | New Dwelling Completion | 2012Q1 | 23.0 |
Working with dates and times
By default, all columns except the value column contain strings (object dtypes). The Time Variable column can be converted to a pandas datetime format by setting convert_dates=True when loading a dataset:
from pycsodata import CSODataset

ds = CSODataset("NDQ05", drop_national_data=True, convert_dates=True)
df = ds.df("tidy")
df.dtypes
Quarter period[Q-DEC]
Local Authority object
New Dwelling Completion float64
dtype: objectThis allows us to easily perform additional manipulations, like extracting the Year from the Quarter, and then summing all new dwelling completions in each year:
df["Year"] = df["Quarter"].dt.year
df_grouped = df.groupby('Year')['New Dwelling Completion'].sum().reset_index()
df_grouped.head()| Year | New Dwelling Completion | |
|---|---|---|
| 0 | 2011 | 6994.0 |
| 1 | 2012 | 4911.0 |
| 2 | 2013 | 4575.0 |
| 3 | 2014 | 5518.0 |
| 4 | 2015 | 7219.0 |
We can then plot this:
import matplotlib.pyplot as plt

plt.plot(df_grouped['Year'], df_grouped['New Dwelling Completion'], marker='o')
plt.title('New Dwelling Completions in Ireland by Year')
plt.xlabel('Year')
plt.ylabel('Number of Completions')
plt.show()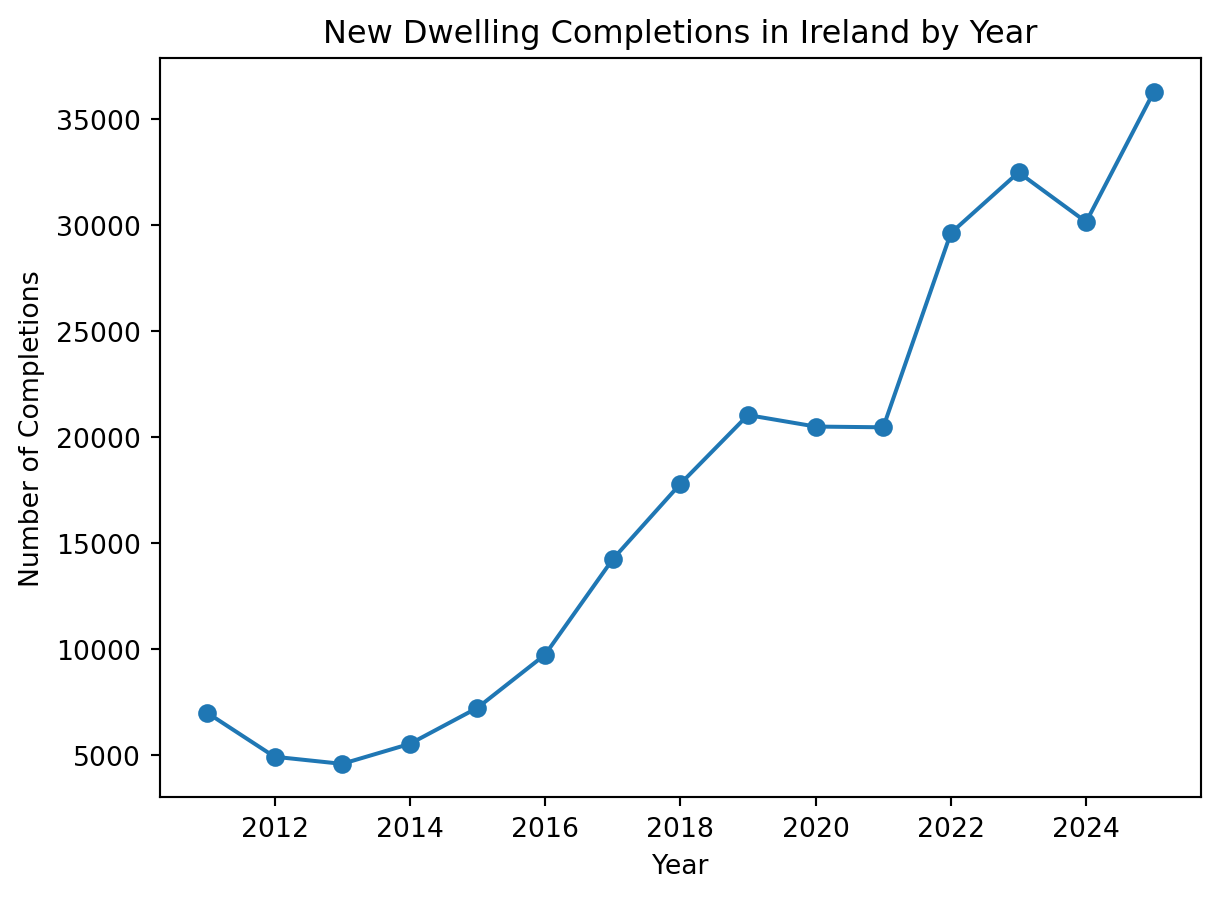
Loading spatial data
Since the NDQ05 dataset’s .describe() method shows that it has the tag Geographic Data, we can get a geopandas GeoDataFrame for this dataset as follows:
from pycsodata import CSODataset

# Get data just for most recent quarter as a GeoDataFrame
ds = CSODataset("NDQ05",
                filters={"Quarter":["2025Q4"]},
                drop_filtered_cols=True,
                drop_national_data=True,
                convert_dates=True
                )
gdf = ds.gdf("tidy")
gdf.head()| Local Authority | New Dwelling Completion | geometry | |
|---|---|---|---|
| 0 | Cork City Council | 399.0 | POLYGON ((-8.38406 51.90423, -8.38062 51.90335... |
| 1 | Clare County Council | 164.0 | MULTIPOLYGON (((-8.31674 52.98514, -8.30983 52... |
| 2 | Cavan County Council | 98.0 | POLYGON ((-7.75102 54.10173, -7.75103 54.10212... |
| 3 | Cork County Council | 730.0 | MULTIPOLYGON (((-8.18321 52.28768, -8.17858 52... |
| 4 | Carlow County Council | 101.0 | POLYGON ((-6.9719 52.80941, -6.97141 52.80927,... |
We can then easily plot the data on a chloropleth map:
import matplotlib.pyplot as plt

gdf.plot(column='New Dwelling Completion', legend=True, cmap='OrRd')
plt.title('New Dwelling Completions by Local Authority - 2025 Q4')
plt.show()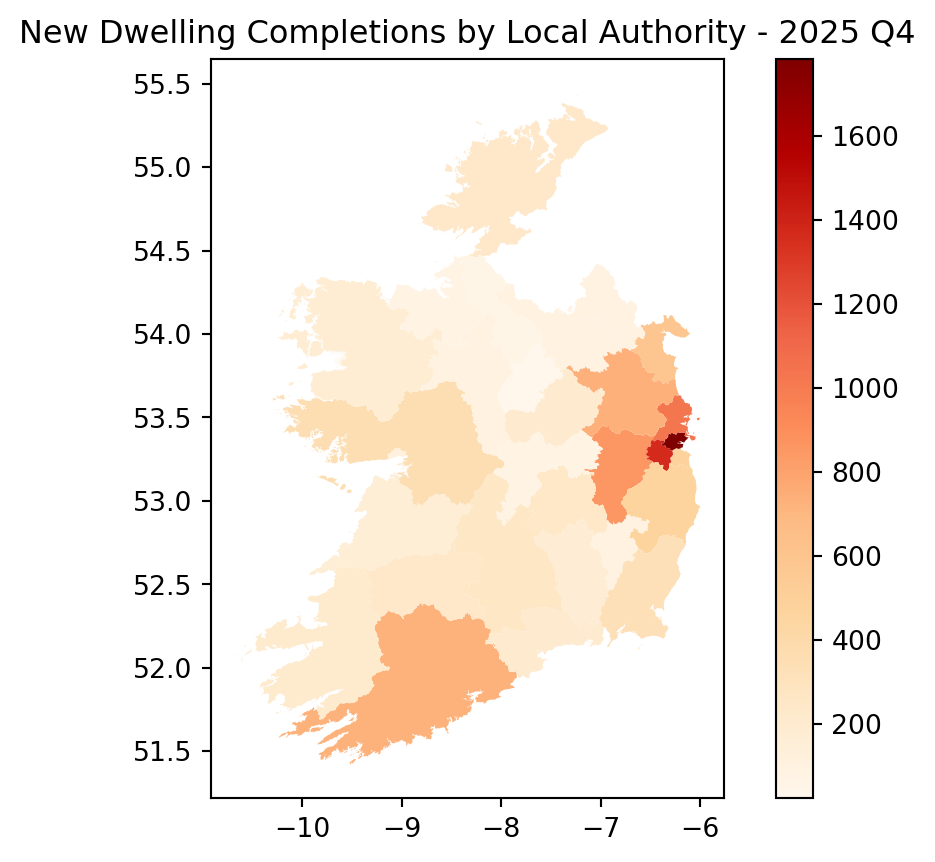
By default, pycsodata uses the generalised geometries supplied by the CSO API, which should be sufficient for most purposes. In cases where the detailed ungeneralised geometries are required, these can (usually) be downloaded from Tailte Éireann and merged automatically to form a GeoDataFrame by passing ungeneralised=True to .gdf(). These ungeneralised geometries are cached to disk, and can be reloaded using force_reload_geometries=True in .gdf().
Managing the cache
The cache is managed using the CSOCache class, which is shared across all CSODataset and CSOCatalogue instances.
from pycsodata import CSOCache

cache = CSOCache()

cache.info()
CacheInfo(size=4, maxsize=256, ttl_seconds=86400, hit_rate=77.8%)To flush the cache, simply call .flush():
cache.flush()Flushing HTTP response cache.